 Sign in
Sign up
Sign in
Sign up
Sign in
Sign up
Sign in
Sign up
Most "observability" vendors are three products in a trench coat — metrics you bought, logs you bought again, traces you'll buy next year, alerts as an add-on, on-call sold separately. PulseBoard is one MIT-licensed edge runtime that does the whole job, plus the cloud-poller fleet that brings AWS, Azure and Google Cloud into the same UI.
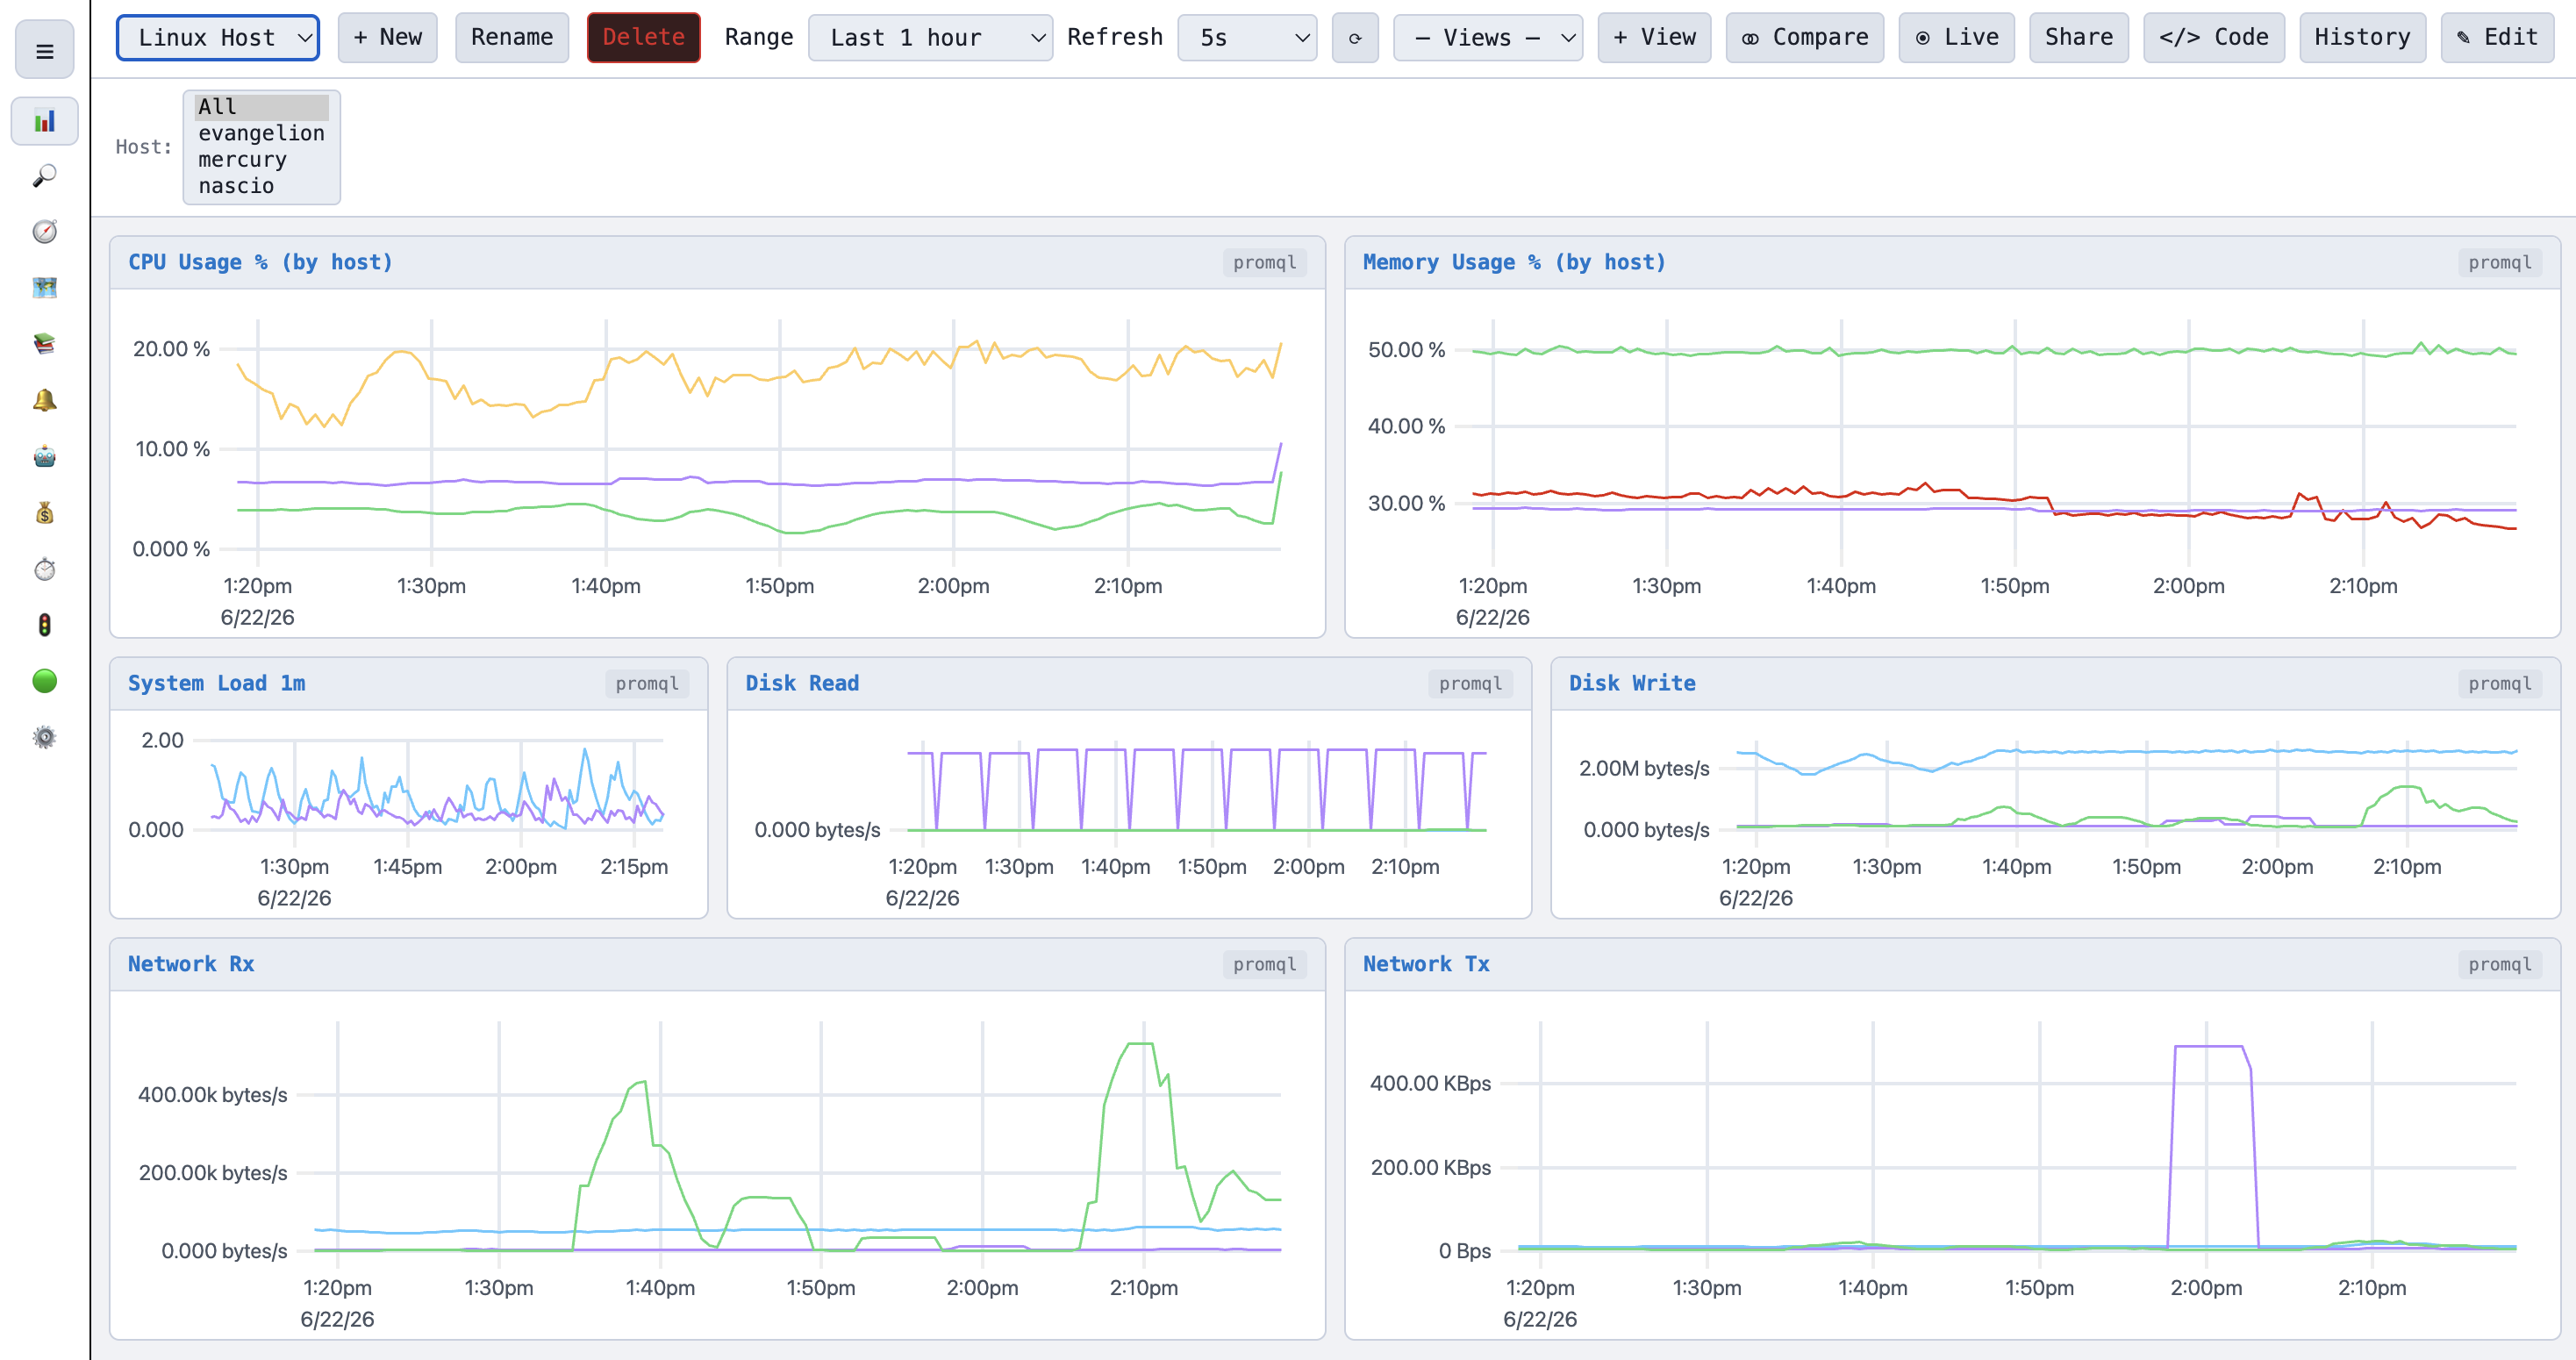
The edge runtime accepts Prometheus remote_write, OTLP/HTTP,
Loki push and a native JSON ingest API on the same port. Every sample is
deduplicated, attributed to a workspace, label-relabelled and written into
the in-process engine. PromQL evaluation — rate(),
avg by(), joins, subqueries — runs in milliseconds against the
local index, or transparently delegates to a Mimir back-end when you point
--mimir-url at one.
Labels live inline in the metric name as a Prometheus series string
(http_requests_total{service="checkout"}). One canonical
string keys storage, the index, queries, alerts and cost attribution.
Point at any Mimir/Cortex back-end for long-term storage and unbounded cardinality. PulseBoard handles tenant headers, query proxying, ingestion buffering and graceful fallback to local storage on outage.
Push from Promtail, Alloy, Vector or PulseAgent at /loki/api/v1/push.
Query at /api/loki/api/v1/query_range with the same bearer
token. Logs sit next to metrics in dashboards: the same time range, the
same label selectors, the same workspace scope.
Substring, regex, and label predicates with the same operators you already know.
The Logs panel tails live as new entries arrive; click any line to pin it to a trace span or alert.
The redact_pii processor in PulseAgent masks card numbers, JWTs and email addresses before bytes leave the host.
PulseAgent (or any OTel SDK pointed at /v1/traces) ships spans
in OTLP/HTTP. The edge extracts caller→callee edges, span error rates and
duration histograms. The Traces view renders a service map plus a
per-trace waterfall — error spans highlighted, exceptions inlined as events.
Both binary protobuf and the JSON encoding are accepted on the same path. No collector required.
EventBridge → Firehose → PulseBoard turns AWS Step Functions executions into spans with task children and exception events — no instrumentation in your state machine.
Branded Node and Python tracer wrappers (@pulseboard/tracer, pulseboard-tracer) for one-line bootstrapping in Cloud Functions, Lambda, AWS App Runner and your own containers.
The embedded rule engine evaluates full PromQL — rate(),
avg by(), arithmetic, joins — entirely in-process. No external
Alertmanager required: routing, grouping, mute windows, inhibition rules
and silences are all native. The routing config is Alertmanager-compatible,
so any existing YAML drops in unchanged.
Webhook, Slack, Discord, Teams, PagerDuty, OpsGenie, SendGrid, Mailgun, SES, Twilio SMS, Jira. Plus a dead-letter queue for failed sends.
Users, rotation schedules with configurable shifts, override windows, multi-step escalation policies — no PagerDuty subscription required.
Attach Markdown step-by-step runbooks to any rule. Incident analytics surface MTTR per fingerprint and your most-skipped steps.
Schedule probes per check, per region, per interval. Results are stored as
a real pulse_synthetic_up{check="..."} series so they compose
with everything else: dashboards, alert rules, status pages. There's no
"synthetics product" sold separately — they're metrics with a probing
scheduler attached.
POST /api/synthetics
{
  "name": "Checkout API",
  "kind": "http",
  "target": "https://api.acme.com/health",
  "intervalMs": 60000,
  "timeoutMs": 5000,
  "regions": ["us-east-1", "eu-west-2"],
  "enabled": true
}/status/<slug> pages, served by the edge.Each component is mapped to a metric threshold or a synthetic check. Uptime percentage is calculated over a configurable look-back window. Active firing rules become incident banners. Auto-refreshing every 30s, no JavaScript framework — just the same edge runtime, no extra hosting.
Threshold-based green/yellow/red, with raw values and trend sparklines.
Active and historic incidents, drawn from firing rules with auto-generated summaries.
30/60/90 days, weighted-by-component or strictly averaged.
timeseries · stat · gauge · bargauge · table · logs · traces · flamegraph · nodegraph · heatmap · state-timeline · status-history · piechart · barchart · histogram · candlestick · xychart · geomap · trend · annolist · alertlist · dashlist · text · canvas · news. Variables and repeats so one dashboard template fans out per region, per cluster or per tenant.
Every dashboard exports to YAML or Terraform HCL via the
</> Code button — paste it into your repo, let the
GitOps reconciler keep it in sync, version-control it like the rest of
your infrastructure.
Observability platforms famously bill by the byte but show you the bill in arrears. PulseBoard inverts that: every team, every series, every byte is attributed in real time, and the cardinality killer can refuse samples that would push you past your contract.
GET /api/admin/tenants/<id>/cost/teams — live per-series and per-team USD attribution, the same endpoint the pricing calculator uses.
Per-label-value caps. When a label crosses the cap, new values are dropped at ingest and the source is logged with the offending series. The bad user_id label never reaches storage.
The killer records the first time a label-value combination appeared. Cross-referenced with the CI deploy log, you get "this deploy introduced 12,400 new request_id values" before it costs you anything.
Point PulseBoard at a Git repo (HTTPS, PAT-authenticated) and a sub-directory. The reconciler polls on a configurable interval, applies new and changed files as create/update, and (when prune is on) deletes anything removed from Git. Every dashboard, rule group and routing config is exportable to YAML or HCL in one click.
# Environment / agent.toml
PULSE_GITOPS_URL=https://github.com/acme/observability
PULSE_GITOPS_BRANCH=main
PULSE_GITOPS_PATH=pulseboard/
PULSE_GITOPS_INTERVAL=60
PULSE_GITOPS_TOKEN_ENV=GH_TOKEN
PULSE_GITOPS_PRUNE=true
The default analyser is deterministic, runs entirely in-process, and uses
classical statistics (mean, standard deviation, single-step jump
detection). Your samples never leave the edge. When you do want an LLM,
swap in an IAiProvider implementation pointing at OpenAI,
Azure OpenAI or any compatible API — including a private deployment.
The hosted cloud is multi-tenant by construction: GitHub OAuth + magic-link email sign-in for humans, workspace bearer tokens for ingest, and Workload Identity Federation against our public OIDC issuer for Azure and Google Cloud cross-account access. Self-host mode supports single-tenant (API-key-only) or full OIDC against any provider.
| Scope | What it can do |
|---|---|
admin | Full access including tenant management and billing |
query | Read metrics/logs/traces; manage dashboards and rules |
ingest | Write-only ingest token, no read access |
The cloud-poller is a separate runtime that holds a fleet of per-account, per-kind, per-region leases in Postgres and atomically claims the next work item every tick. AWS uses STS AssumeRole with a server-minted ExternalId; Azure and GCP use Workload Identity Federation backed by our OIDC issuer so we never store client secrets.


Azure Monitor across VMs, App Service, AKS, SQL, Cosmos, Service Bus, Key Vault…
Azure deep-dive →
Cloud Monitoring · Cloud Logging · Cloud Billing · GKE · Cloud Run · Cloud Functions
GCP deep-dive →